A new mapping of farms’ crop yield results this harvest season has been released, helping to build a picture of geographical variety performance.
The Syngenta Harvest Yield Map 2017 will collate growers’ reported results into a UK wide resource of variety performance trends by region, with detail down to postcode area.
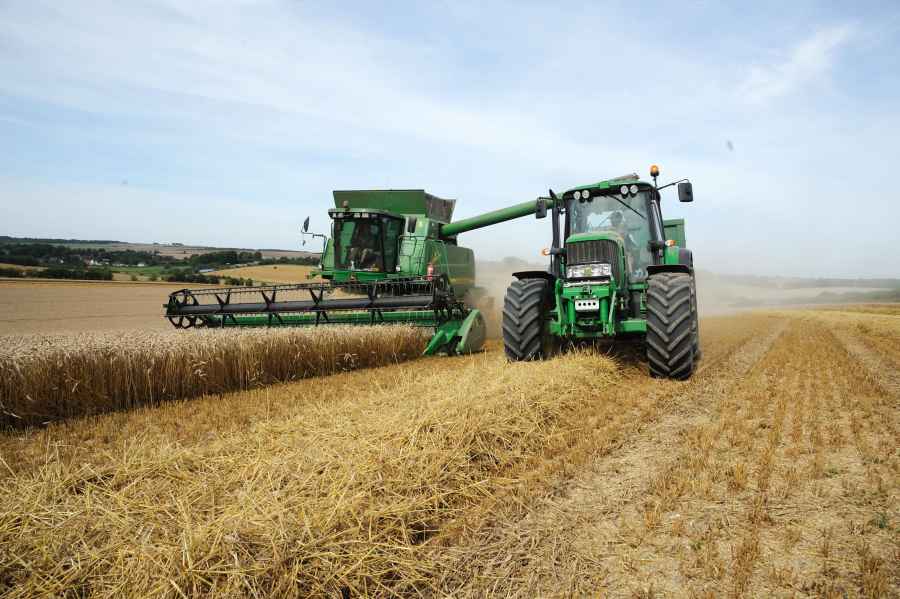
Combines have been rolling well across hot and dry southern and eastern counties, but still for the most part in the sheds for northern areas where weather conditions have been cool and wet.
Syngenta Marketing Communications Lead, Cat Gray, highlighted the harvest data will give an insight into how all different varieties have performed under the UK’s extremely variable conditions this season.
“Growers have experienced a huge North/South divide in climatic conditions this year. Over recent months, for example, it has been cool and wet in the north, in stark contrast to blistering hot, dry weather in the south and east” she said.
“The Harvest Yield Map will help to indicate how different varieties have coped with the variable conditions, and an indication for future cropping options to consider.”
Whilst many other factors influence final yield on farm, the harvest results do give a reliable reference point for relative variety performance under regional conditions.